
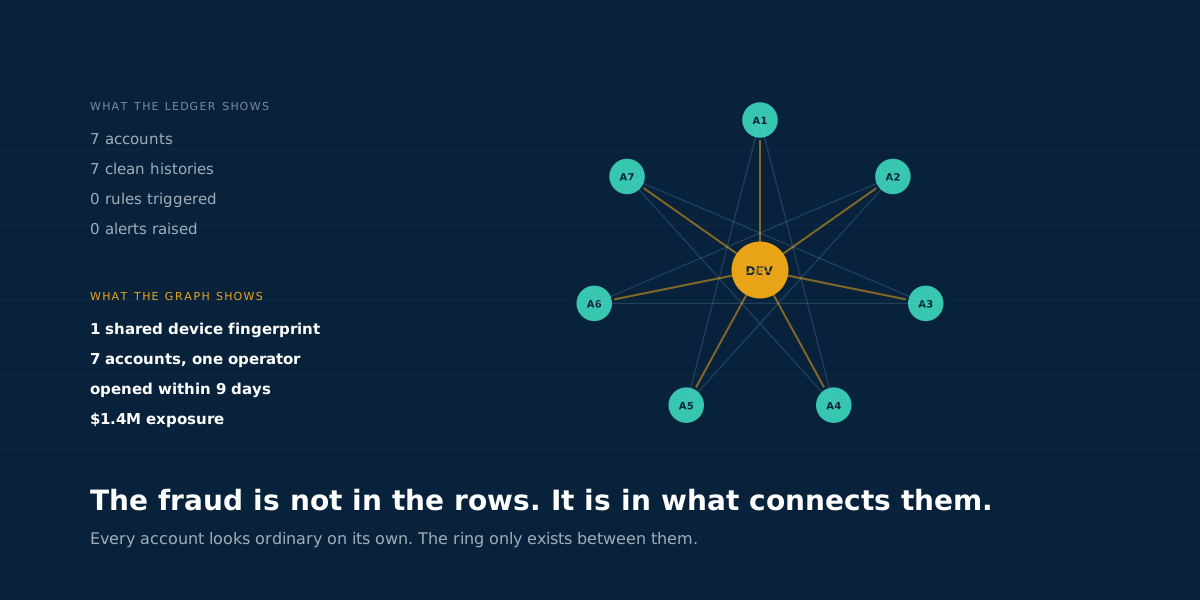
Seven accounts. Seven clean histories. Every transaction under the reporting threshold, every profile complete, no rule triggered, no alert raised. And one device fingerprint behind all seven, opened across nine days, with $1.4 million of exposure between them.
That is the shape of organised fraud, and it is the shape a transaction-level rules engine is structurally unable to see. Not because the rules are bad. Because the question they ask is the wrong one.
Why row-based detection misses the expensive cases
A rules engine evaluates one transaction against a threshold. Is the amount unusual for this account, is the geography implausible, is the velocity high. Each of these is a reasonable question and each is answered using only the row in front of it and that account's own history.
Professional fraud is designed against exactly that. Keep every amount modest, every account's behaviour ordinary, every profile complete. The scheme only exists in aggregate, distributed across accounts that individually look like your best customers. The annual ACFE Report to the Nations makes the same point repeatedly in its case data: the schemes that cost the most are the ones that ran longest without tripping anything.
The other cost is the one nobody puts in a business case. Rules generate false positives at a rate that scales with coverage, and every false positive is investigator time. Tighten the rules and you miss more. Loosen them and your team drowns. There is no setting that fixes it, because the model has no way to distinguish a customer who looks odd from a customer who is connected to something odd.
The shapes fraud makes in a graph
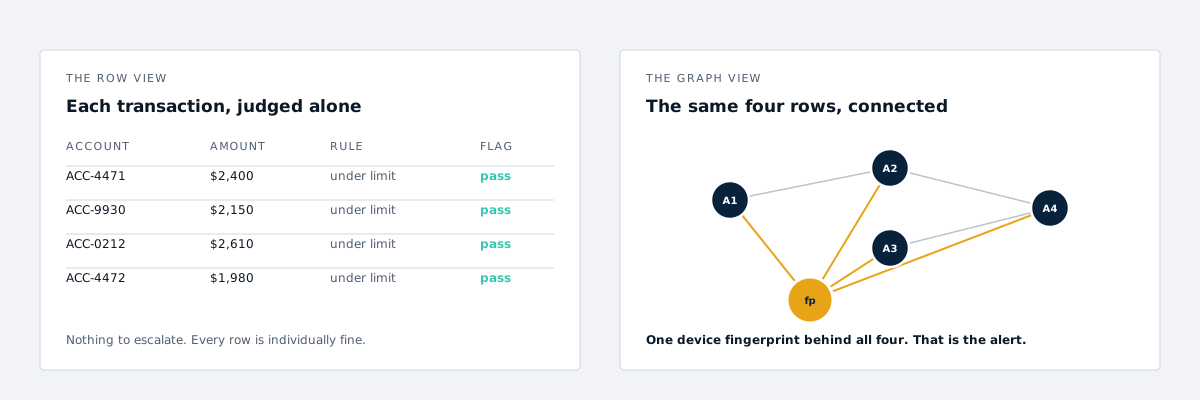
Model the same data as a graph and the picture changes. Accounts, people, devices, addresses, phone numbers, payment instruments and merchants all become nodes. The observations connecting them become edges. Fraud then stops being a property of a transaction and becomes a topology.
A handful of shapes carry most of the value:
- The star. Many accounts converging on one shared attribute. A device, an address, a recovery email. The cheapest and most reliable signal in the entire field.
- The dense component. A group of accounts transacting mostly with each other and rarely with anyone outside it. Collusive sellers, review rings, circular payment flows.
- The bridge. One account whose removal would split a network in two. Mule accounts sit here almost by definition, which makes them findable before the money moves.
- The synthetic cluster. Identities that share fragments of real people, assembled into new combinations. Each looks legitimate; together they overlap in ways no genuine population does.
None of these are detectable in a row. All of them are a single query in a graph.
Three algorithms that earn their place
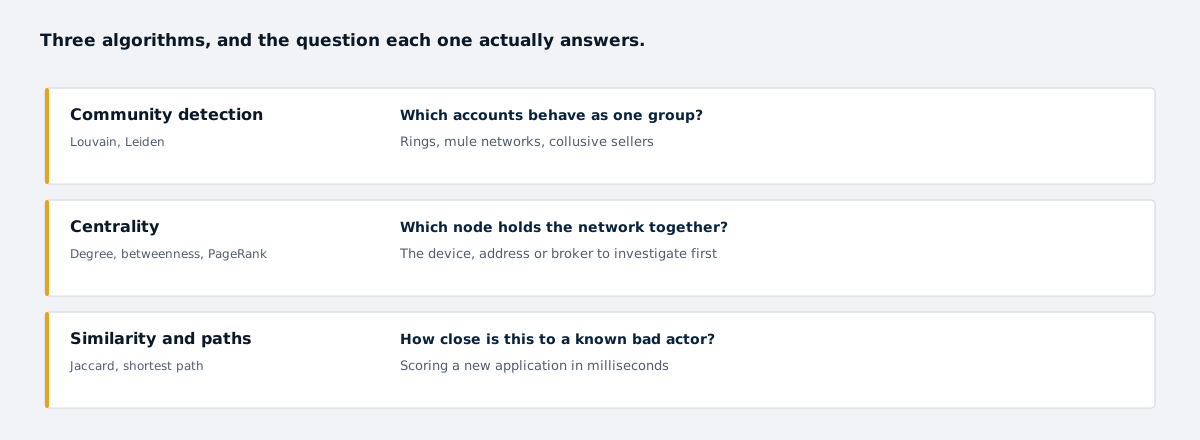
Community detection. Louvain and its successors partition a network into groups with more internal connection than external. Run it over your account graph and the communities are candidate rings. The output is not an accusation, it is a prioritised list of groups worth a human look, ordered by how implausibly tight they are.
Centrality. Degree centrality finds the shared attributes everything hangs off. Betweenness centrality finds the brokers, the accounts that traffic flows through. When an investigator asks which of forty linked accounts to open first, centrality is the answer, and it is the difference between a two-day investigation and a two-hour one.
Similarity and pathfinding. For real-time decisions you are not partitioning the whole graph. You are asking how many hops separate this new application from a confirmed bad actor, and through what. That is a bounded traversal, it runs in milliseconds, and it is the piece that moves fraud detection from post-hoc to preventive.
These are all standard operations in the Neo4j Graph Data Science library, which matters practically: you are configuring well-tested implementations rather than writing graph algorithms, and they run inside the database instead of dragging the network into a notebook.
Building it without boiling the ocean
The instinct is to model everything. Resist it. The fastest route to value follows a narrower path.
Start with one fraud type you already know you have, and the two or three linking attributes your investigators already talk about. Device fingerprint and address get you a long way in account opening fraud. Payment instrument and shipping address cover most card-not-present cases. Load six months of history, not five years.
Then run the shapes against known cases first. You have a set of confirmed fraud from last year. Build the graph, run community detection, and check whether your confirmed cases fall into tight communities. If they do, you have validated the approach on data where you already know the answer, and you have a defensible number to take to a steering committee. If they do not, you have learned something important cheaply.
Only then move to scoring live traffic. And when you do, score the neighbourhood rather than the transaction: how connected is this account to anything previously confirmed, through how many hops, on how many distinct attribute types. Multiple weak connections through different attribute types are far more damning than one strong connection through a single one.
Real time, batch, and the decision between them
Two deployment shapes cover almost every case, and they have different engineering costs.
Batch discovery runs overnight across the whole graph, finds communities and unusual structures, and hands investigators a queue in the morning. It is the cheaper build, it catches the schemes already operating inside your book, and it is where almost everyone should start. Nothing has to be fast, so the algorithms can be exhaustive.
Real-time scoring evaluates a single application or transaction against the existing graph before it completes. The constraint is brutal and specific: the whole traversal has to finish inside the time a user will tolerate a spinner, which in practice means tens of milliseconds. That rules out whole-graph algorithms and forces you into bounded local traversals and pre-computed features.
The pragmatic path is to build batch first and harvest features from it. Once you know which shapes actually predict fraud in your data, you can materialise the small number of properties that matter, attach them to nodes, and read them at decision time without traversing anything. That is how a two-second analytical query becomes a five-millisecond production check.
What it costs to be wrong
Two errors, two very different bills. A false positive freezes a legitimate customer, generates a complaint, and burns investigator hours. A false negative pays out. Most institutions discover that their tolerance is wildly asymmetric and that nobody has written the asymmetry down.
Write it down before you tune anything. If a missed case costs forty times a false alert, that ratio is your threshold, and it should be a documented business decision rather than an accident of whatever the default was. Examiners expect that reasoning to exist on paper: the FFIEC BSA/AML Examination Manual sets out what supervisors look for in monitoring systems and the thresholds behind them. Payments fraud reporting from bodies such as the the Federal Reserve's payment systems research is a reasonable external reference point when you need to benchmark the exposure side of that calculation.
Entity resolution is the prerequisite
Everything above assumes you know which records refer to the same thing. If one person exists as four accounts because the addresses were typed differently, your graph has four disconnected nodes where it should have one, and the ring you were looking for does not appear.
This is the most common reason graph fraud projects underperform, and it is not a graph problem. It is a resolution problem, and it needs solving first. our guide to entity resolution techniques covers the techniques, and the ordering is not negotiable: resolve, then model, then detect.
False positives, investigators, and the part that decides adoption
A graph system that is right more often but produces output investigators cannot act on will be abandoned inside a quarter. The interface matters as much as the algorithm.
What works is giving the investigator the subgraph, not a score. Here are the eleven accounts, here is the attribute they share, here is when each was opened, here is the total exposure, here is which one the centrality measure says to open first. That is a case file. A risk score of 0.86 is not.
Feed decisions back. Every confirmed and dismissed case is a label, and labels are what let you tune thresholds against your own population instead of a vendor default. Regulated institutions have to document this anyway under FinCEN reporting requirements, so the reporting obligation and the model improvement loop can be the same pipeline.
Done properly the numbers move hard. Bank of America surfaced more than $2B in fraud patterns using exactly this approach. The technique is not experimental and the tooling is not exotic; what it needs is the right model and someone who has built one before.
If you have a fraud problem that your rules keep missing, the useful first conversation is about which shapes your scheme makes, not which software to buy. Our Neo4j consulting practice is what that engagement looks like.